The property market is down. Prices can fall further. That still leaves a fair question: how does the fall measured so far compare with the crash headlines?
A downturn does not need to become a 40% collapse to be real. And a warning does not become a fact because it sounds certain.
The headline people saw in 2020
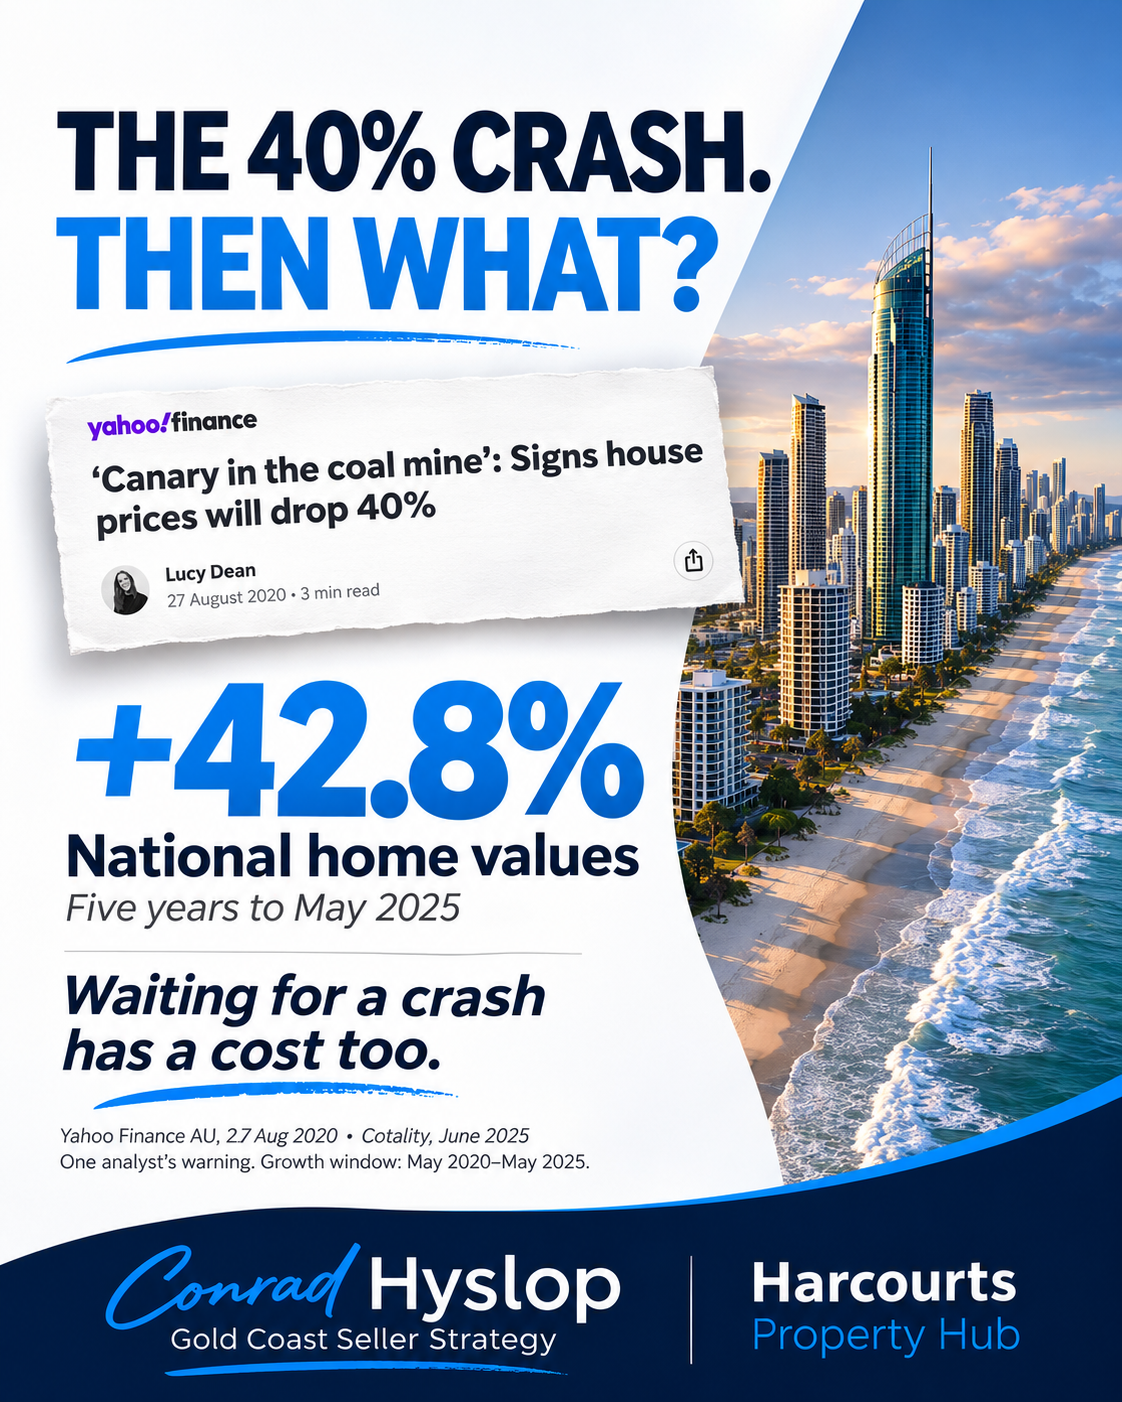
On 27 August 2020, Yahoo Finance AU ran this headline: ‘Canary in the coal mine’: Signs house prices will drop 40%.
The story reported analyst Martin North's view. It was one analyst's warning, not a forecast shared by every bank or economist. He also said results would vary between places.
The headline is worth keeping beside what followed.
What happened over the next several years?
Cotality's June 2025 chart pack shows national home values rose 42.8% over the five years to May 2025. That added about $250,000 to the national median home value.
The growth window starts in May 2020, three months before that August headline. These are national figures for houses and units together. They do not mean every property rose by 42.8%, or that the same growth lies ahead.
But the contrast is large. People saw a warning of deep falls. Over the following years, the broad national result was a strong rise.
Now look at the market we are in
The October 2026 REA/PropTrack figures put Gold Coast houses 3.6% below their peak. Units were 0.59% below peak. The combined Gold Coast home measure was about 3% below peak.
Those are falls from the peak, not six-month falls. The 3.6% house figure is not the national result.
Cotality's separate national index was 6.7% below its March 2026 peak at the end of October. It uses a different model and covers a different market, so it should not be swapped with the Gold Coast figure.
Both sets of figures show a downturn. Neither tells us where the bottom will be.
So could prices fall further?
Yes. The measured fall is where we are, not a limit on what can happen next.
Higher loan costs and weaker borrowing power can reduce what buyers can pay. If more owners need to sell while demand falls, prices can face more pressure. Jobs, incomes, housing supply and policy also affect the result.
Those forces can change. So can forecasts. A sharp warning should be checked against new evidence, rather than treated as a promise.
What the old headline does—and does not—show
It shows why extreme claims deserve a check against the result. It does not prove that today's downturn will be short, that prices must bounce, or that now is the right time for everyone to buy or sell.
Past growth can leave some owners with a buffer. It does not remove the loss from a recent peak, help every recent buyer, or pay a mortgage.
Waiting can carry a cost. Buying or selling at the wrong time for your own finances can carry a cost too.
My view: keep the scale in the story
We can recognise a down market without treating the worst case as settled. We can question a crash headline without pretending prices are rising.
That is the balance I want from these comparisons: what was said, what happened, what is being measured now, and what we still do not know.
The downturn is real. How far it goes is still an open question.
Check the current Gold Coast figures before an old warning or a broad national number drives your next decision.
Sources and dates
Checked 11 November 2026. Figures are dated index measures, not a valuation of an individual property. Later data may change the picture.