The Gold Coast market has not crashed. But it has changed.
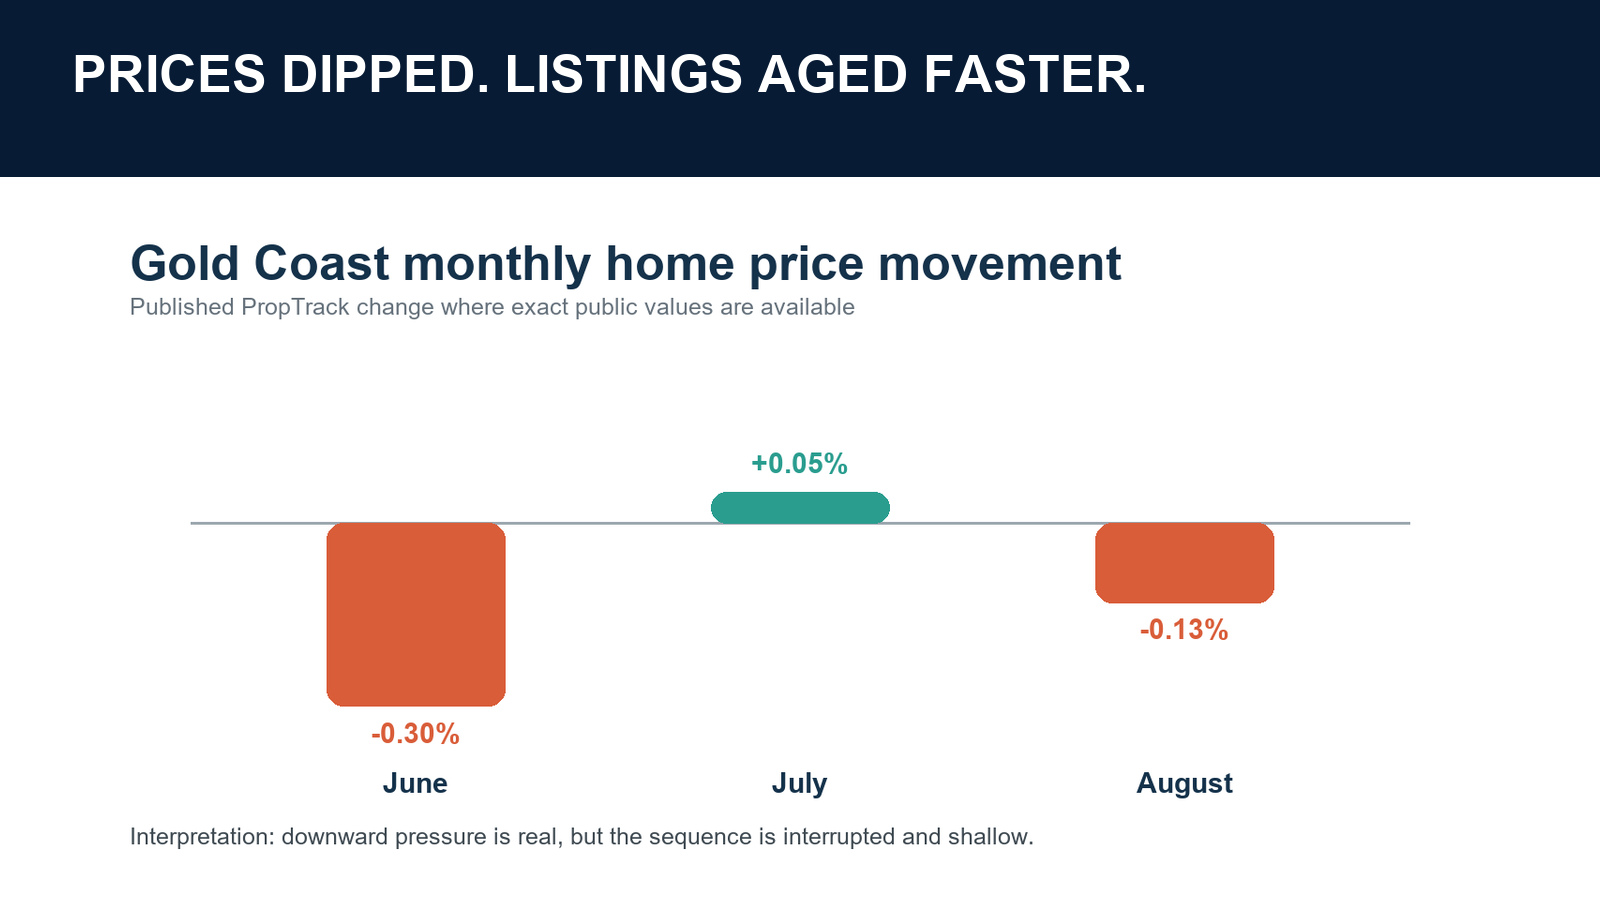
After years of strong annual growth headlines, the latest monthly figures show a flatter market. Prices slipped in June, edged higher in July, then moved down again in August. At the same time, advertised stock increased and a larger share of listings stayed on the market for 60 days or more.
For sellers, that second signal matters. A small monthly price fall can make a headline. A growing pool of older listings can change how buyers behave.
The monthly price trend has turned flatter
PropTrack's Gold Coast home price index recorded a 0.30% fall in June 2026, a 0.05% rise in July and a 0.13% fall in August. That left prices only 0.38% lower across those three monthly movements.
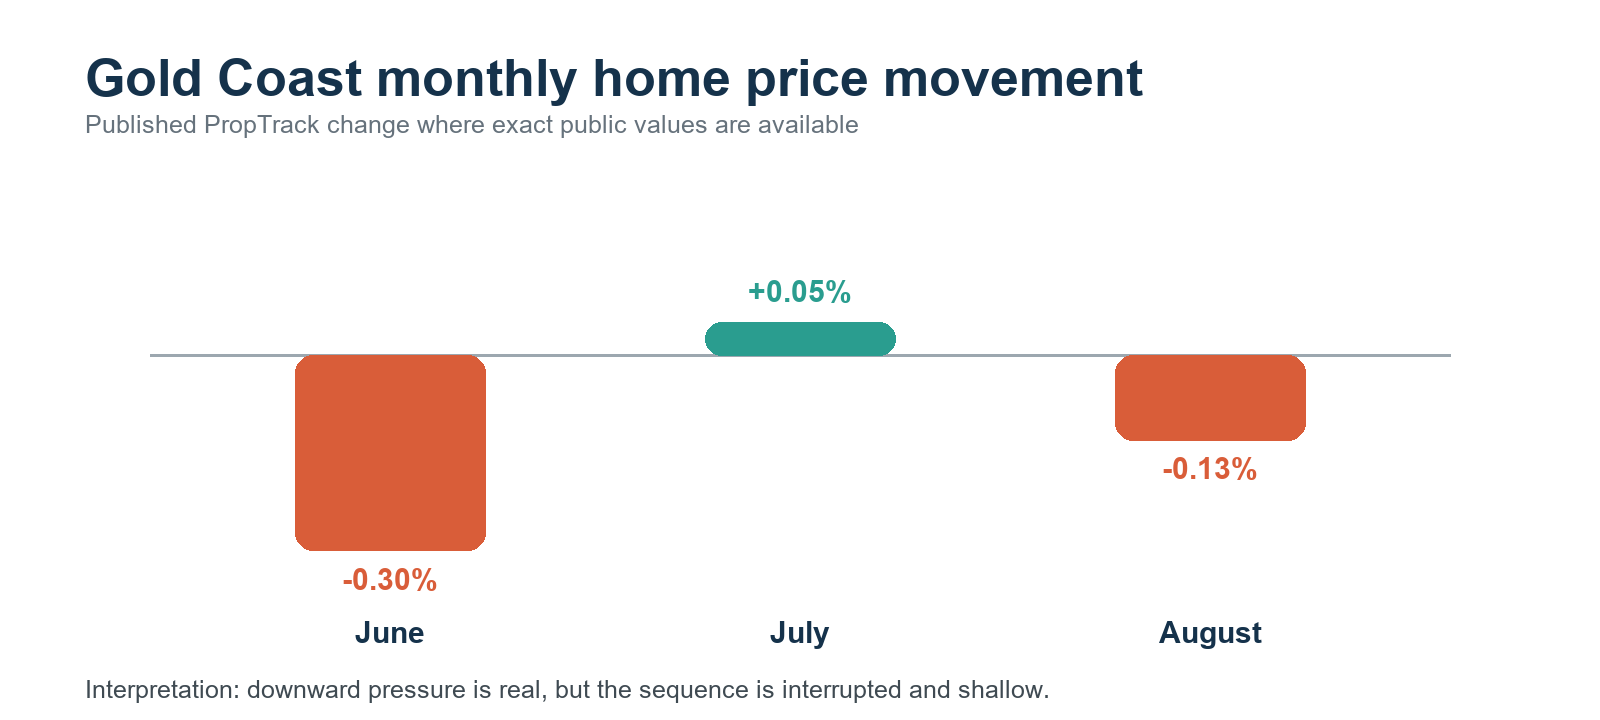
That is a turn, not a collapse. It also sits beside much stronger annual figures. PropTrack still reported Gold Coast prices 14.0% higher over the year to August. Both numbers can be true: annual growth describes where prices came from, while the latest monthly readings show how the market is moving now.
Advertised stock is the bigger seller warning
SQM Research data show total advertised residential stock across the Gold Coast rose from 4,218 properties in March to 5,012 in August. That is an increase of about 19% in five months.
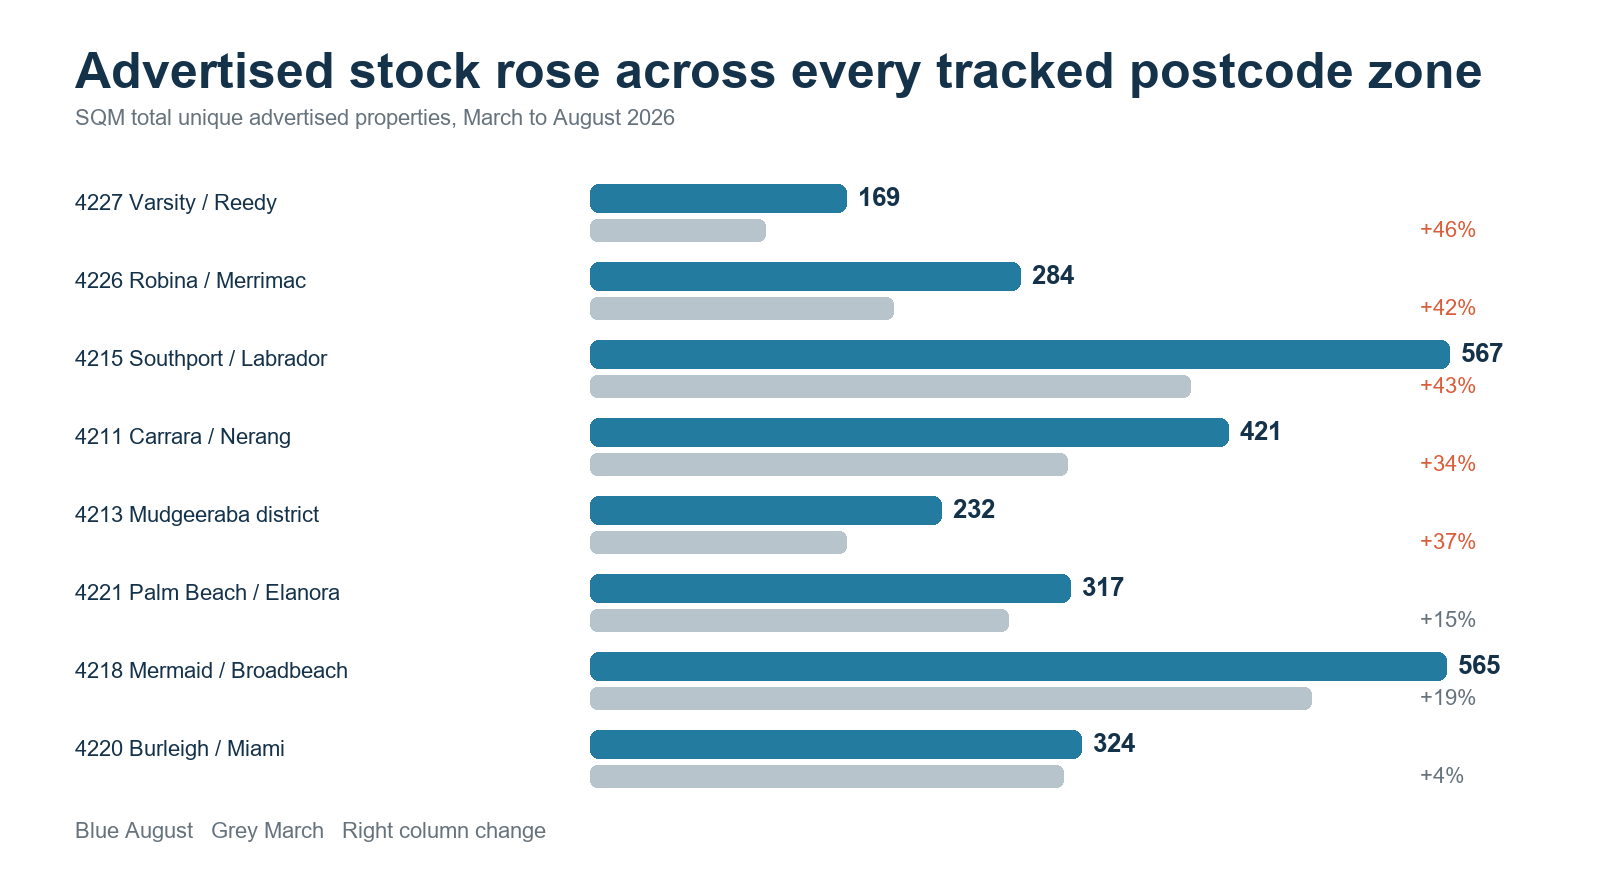
More stock gives buyers more alternatives. It does not mean every seller is under pressure, but it does mean each listing has to compete more clearly on price, presentation and positioning.
More listings are becoming older listings
The number of Gold Coast properties advertised for at least 60 days rose from 1,098 in March to 1,725 in August. The share of total advertised stock in that older group increased from 26% to 34%.
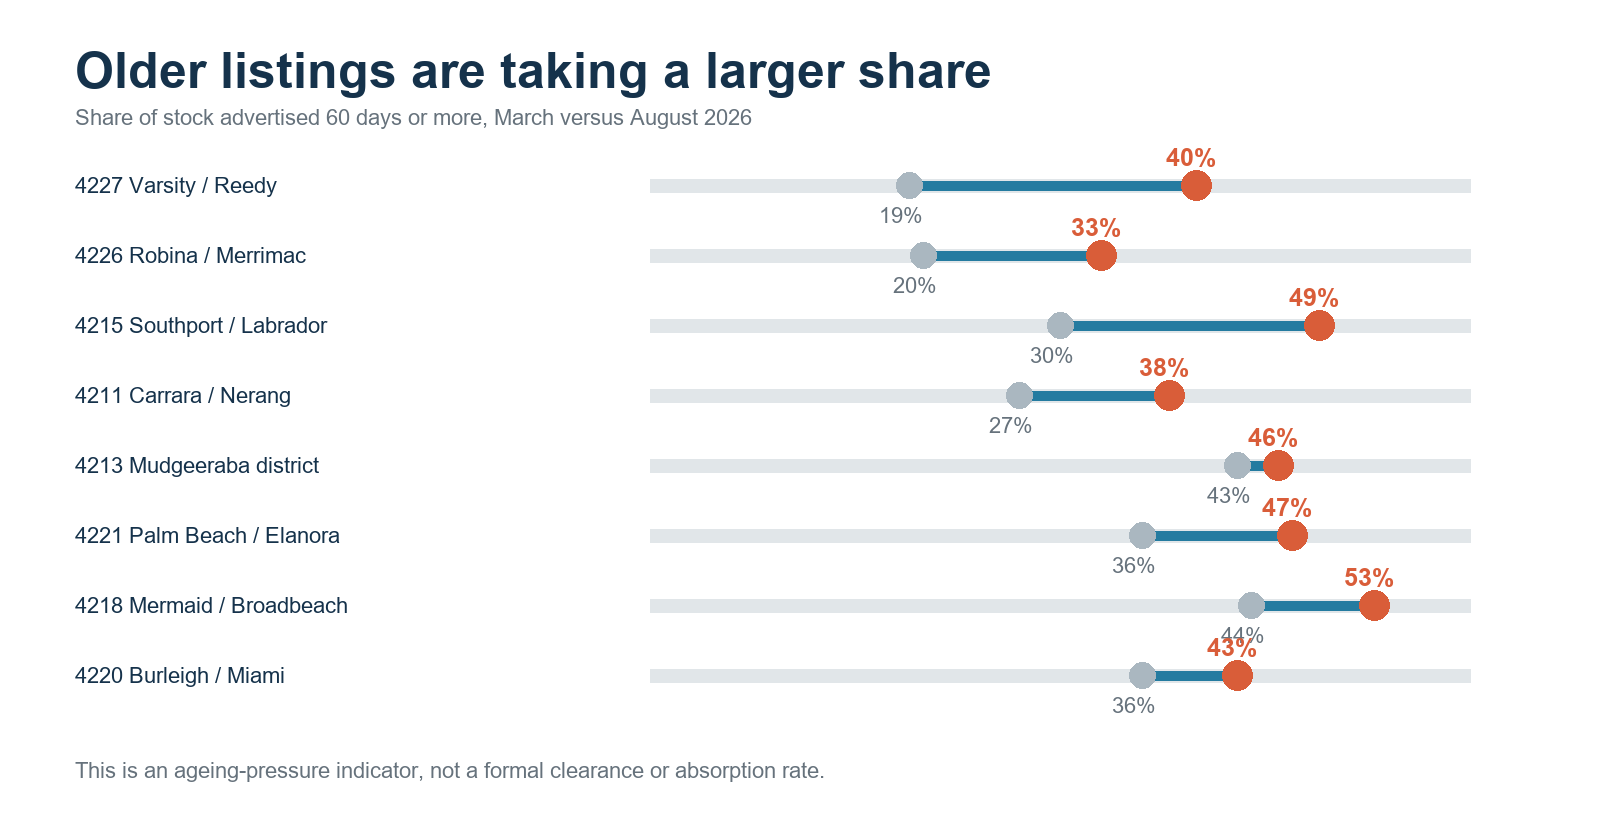
This is not the same as a suburb's median days on market. It is a stock-age measure. The two can sit together: some well-positioned homes can still sell in about a month while a growing pool of other listings remains available much longer.
The suburb picture is not one market
Robina shows why broad headlines can mislead. In the latest local sales window, the house median moved down to $1,372,500, while the unit median barely changed at $885,000 and the townhouse and villa median moved only slightly to $1,025,000. Across postcode 4226, which includes Robina and Merrimac, total advertised stock rose from 200 in March to 284 in August. Listings advertised for at least 60 days rose from 40 to 94.
Varsity Lakes also moved in different directions by property type. Houses dipped to a $1,325,000 median in the latest local window, while units edged up to $882,500. Across postcode 4227, which includes Varsity Lakes and Reedy Creek, total advertised stock rose from 116 in March to 169 in August. Listings advertised for at least 60 days rose from 22 to 67.
Current portal profiles also show different typical selling times around the central Gold Coast. Robina houses are around 34 days, Varsity Lakes houses about 29 days, Palm Beach houses about 30 days and Reedy Creek houses about 44 days. A fixed 28-day rule is too simple for the whole market.
What the headlines get right — and what they miss
The headlines are right that Gold Coast prices have softened month to month. They are also right that annual growth remains strong. What they often miss is the seller's immediate competitive position.
The practical question is not simply, “Is the Gold Coast up or down?” It is: how many similar homes are competing for the same buyers, how long have those homes been available, and what did the closest comparable sales achieve?
What this means if you may sell
This is a market for accurate positioning, not panic. The Gold Coast's three recent monthly price movements add to a modest fall, but stock is higher and more listings are ageing. Sellers who price from last year's annual growth headline may miss what today's buyers can see.
Before choosing a price or timing, compare your property with recent like-for-like sales and the homes competing for the same buyers now. Watch buyer activity in the first two weeks. If the right buyers inspect but do not act, that is useful evidence to review the campaign early.
See the sales and current competition around my property
Sources and data notes
Gold Coast monthly and annual price movement: PropTrack Home Price Index. Advertised stock and stock age: SQM Research. Suburb selling times and market profiles: realestate.com.au. Local Robina and Varsity Lakes sale figures use the existing verified recent-sales reports covering 24 May to 24 August 2026.
Price-index movements, advertised stock, listing age and local settled-sales medians measure different things. Postcode 4226 includes Robina and Merrimac. Postcode 4227 includes Varsity Lakes and Reedy Creek. These figures are market context, not a valuation of an individual property.